Grafana Dashboards
Grafana reads the PostgreSQL storage database directly. Configure a PostgreSQL datasource that points at the same database used by the scraper.
The Docker Compose test stack provisions the datasource automatically from:
docker-compose/grafana/datasources/datasources.yaml
Dashboard JSON files are stored in:
docker-compose/grafana/dashboards/
Included Dashboards
Oracle Alerting Overview
File:
docker-compose/grafana/dashboards/oracle-alerting-overview.json
Purpose:
- Current firing, pending, no-data, and error states from Grafana Alerting.
- Latest collector health across every configured Oracle database.
- Failed or stale collectors requiring investigation.
- Tablespace, finite resource-limit, and ASM capacity risks.
- Latest database and instance state.
- Normal Oracle alert instances that confirm rule evaluation.
This is a global operations dashboard. It intentionally has no
source_database variable: alert responders must see problems from every
monitored database without selecting one first. Database values in PostgreSQL
tables link to the corresponding database in Oracle Operational Overview.
The Alert list panels query Grafana's actual alert-rule state and are authoritative for firing and pending status. PostgreSQL panels provide the current investigation context; they do not independently reproduce Grafana's pending durations, no-data handling, or silences.
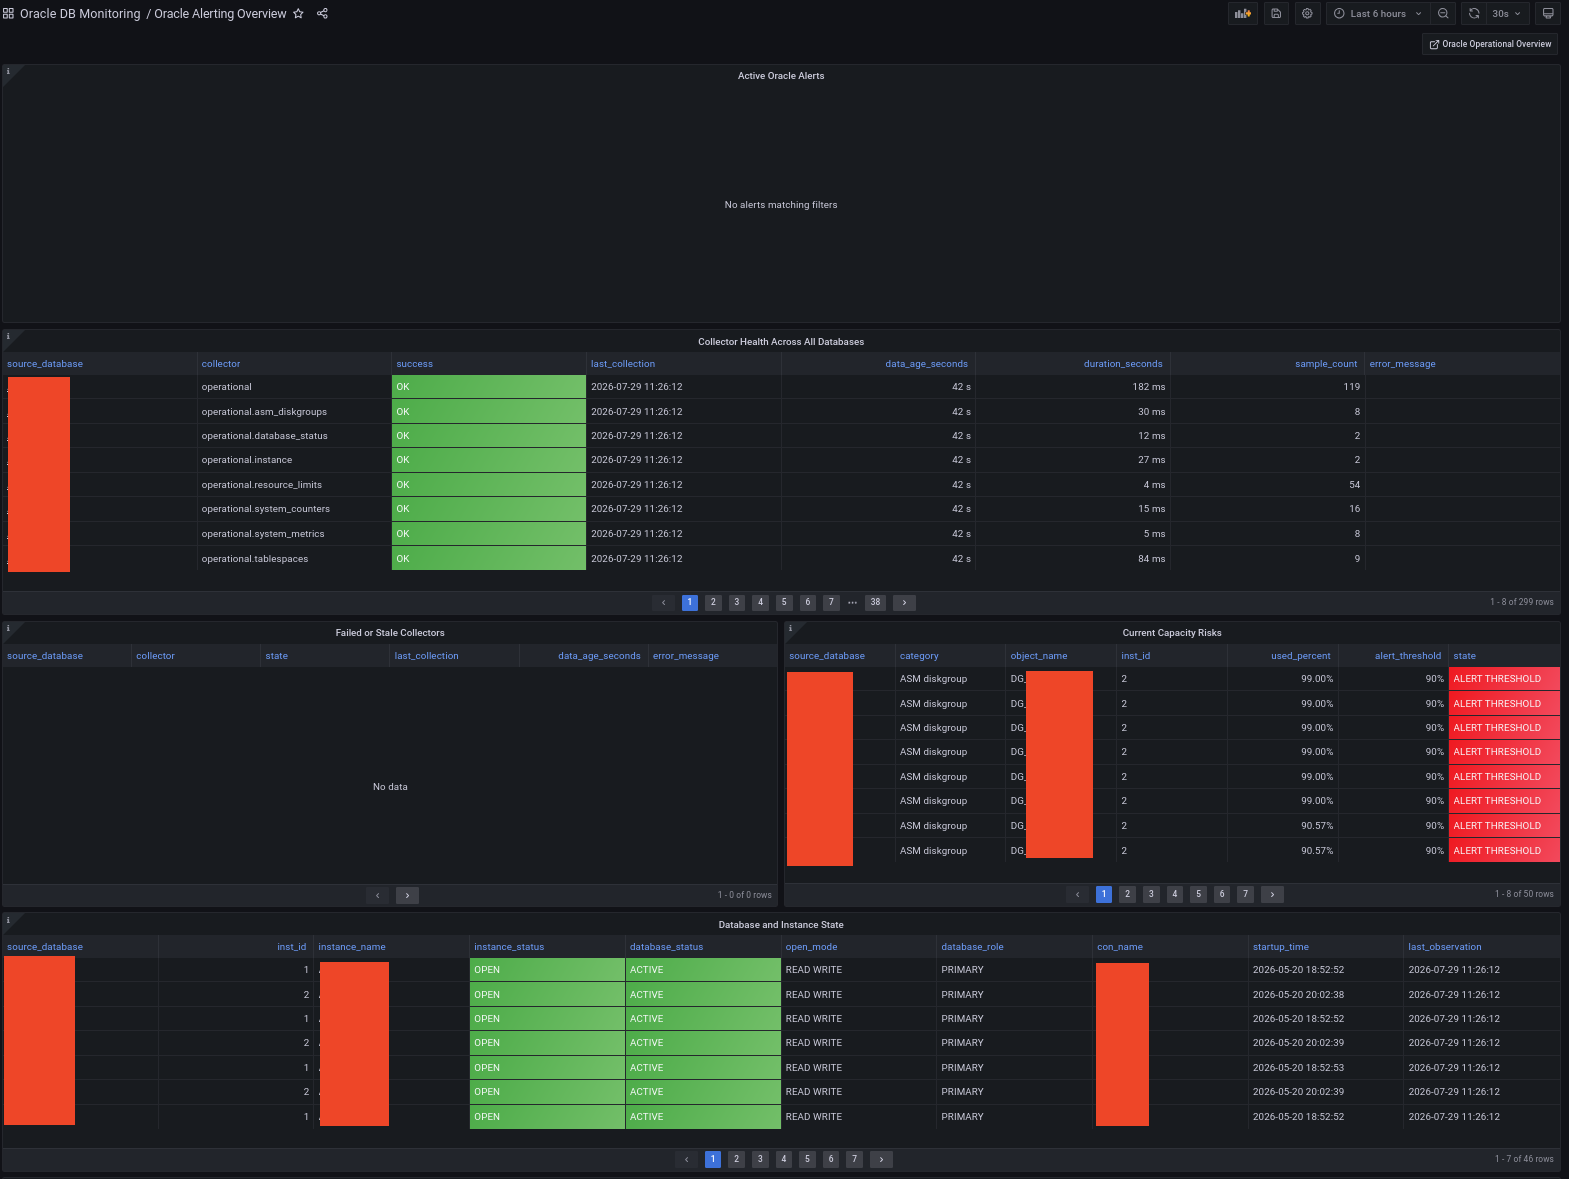
Oracle Alerting Overview dashboard with anonymized sample data. Select the image to open it at full resolution.
Oracle Operational Overview
File:
docker-compose/grafana/dashboards/oracle-operational-overview.json
Purpose:
- Collector success, freshness, duration, and errors.
- Database and instance state.
- Session and process utilization.
- Tablespace and ASM capacity.
- Oracle resource-limit pressure.
- Reset-aware system activity and wait-class rates.
Primary tables:
oracle_database_status_samples
oracle_instance_samples
oracle_resource_limit_samples
oracle_tablespace_samples
oracle_asm_diskgroup_samples
oracle_system_counter_samples
oracle_wait_class_samples
oracle_scrape_status
The dashboard uses native typed operational data. It does not query
oracle_metric_samples.
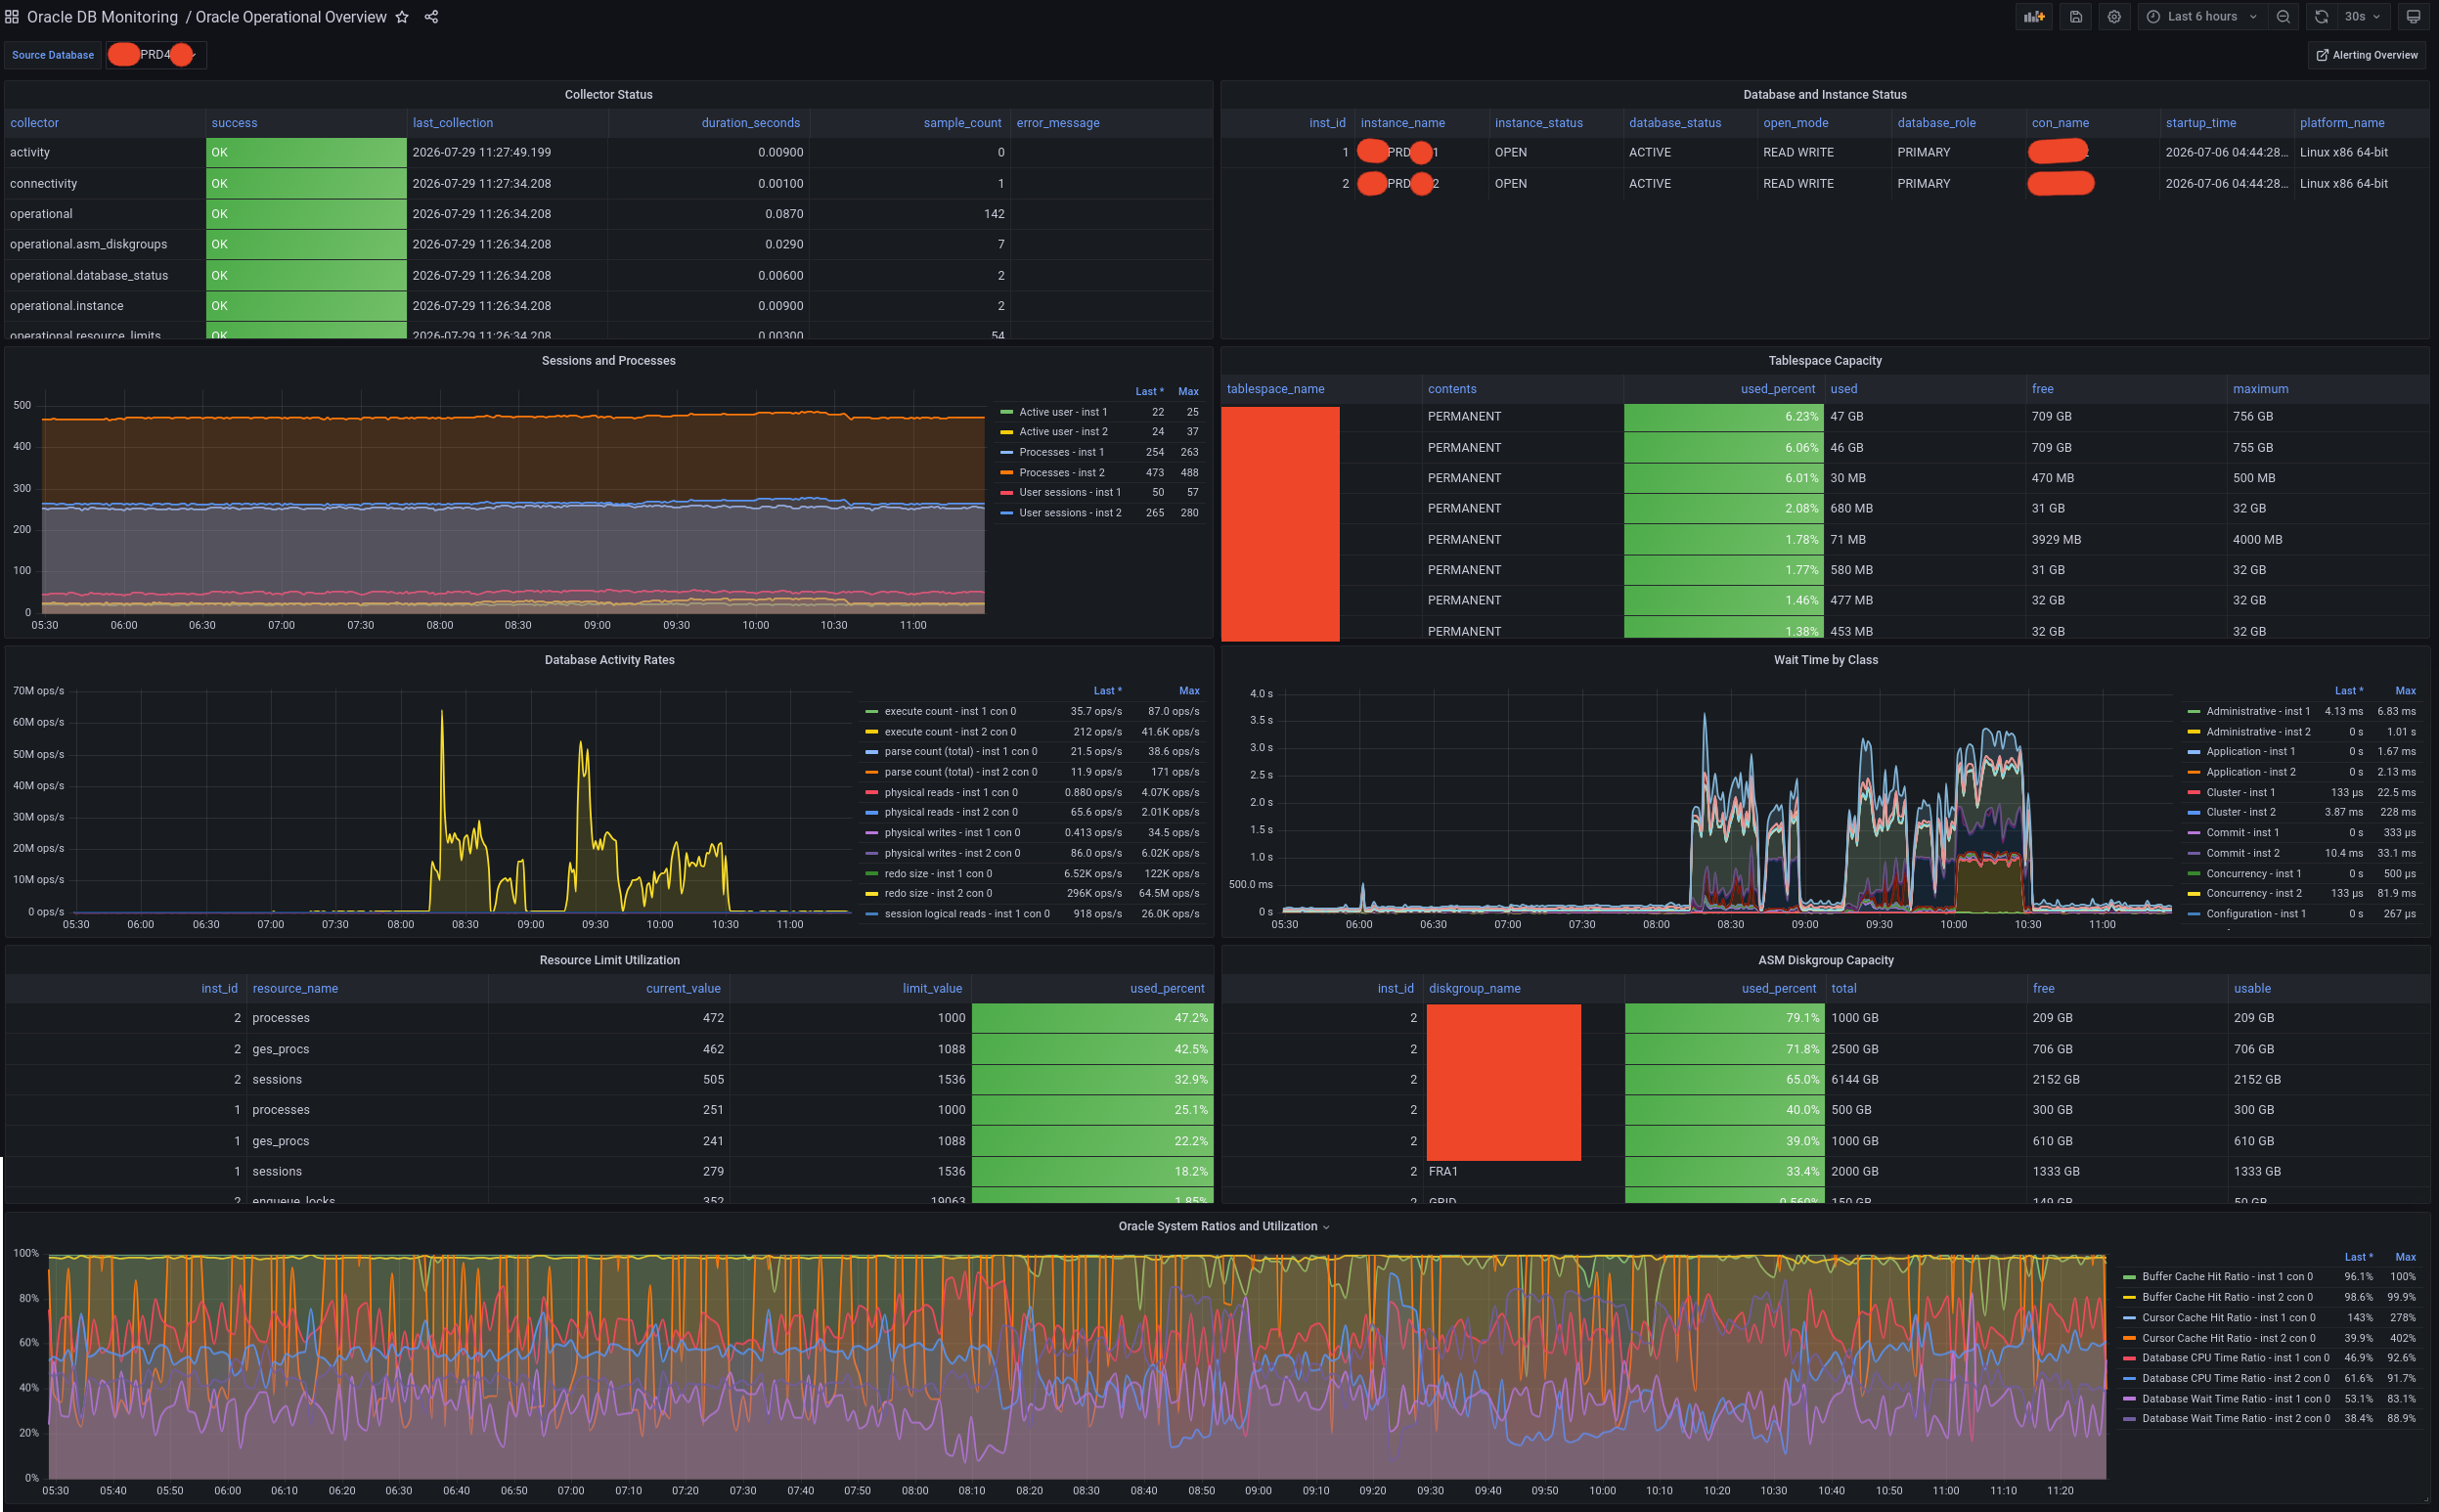
Oracle Operational Overview dashboard with anonymized sample data. Select the image to open it at full resolution.
Database Activity History (DAH)
File:
docker-compose/grafana/dashboards/database-activity-history.json
Purpose:
- Average active sessions by wait class.
- Top SQL by active samples.
- Top sessions by active samples.
- Activity by
SQL_ID. - Recent activity samples.
- Top wait events.
- Module/program activity.
Primary table:
oracle_database_activity_samples
This dashboard is the AAS-style historical activity view. It intentionally uses high-cardinality fields that should not be Prometheus labels.
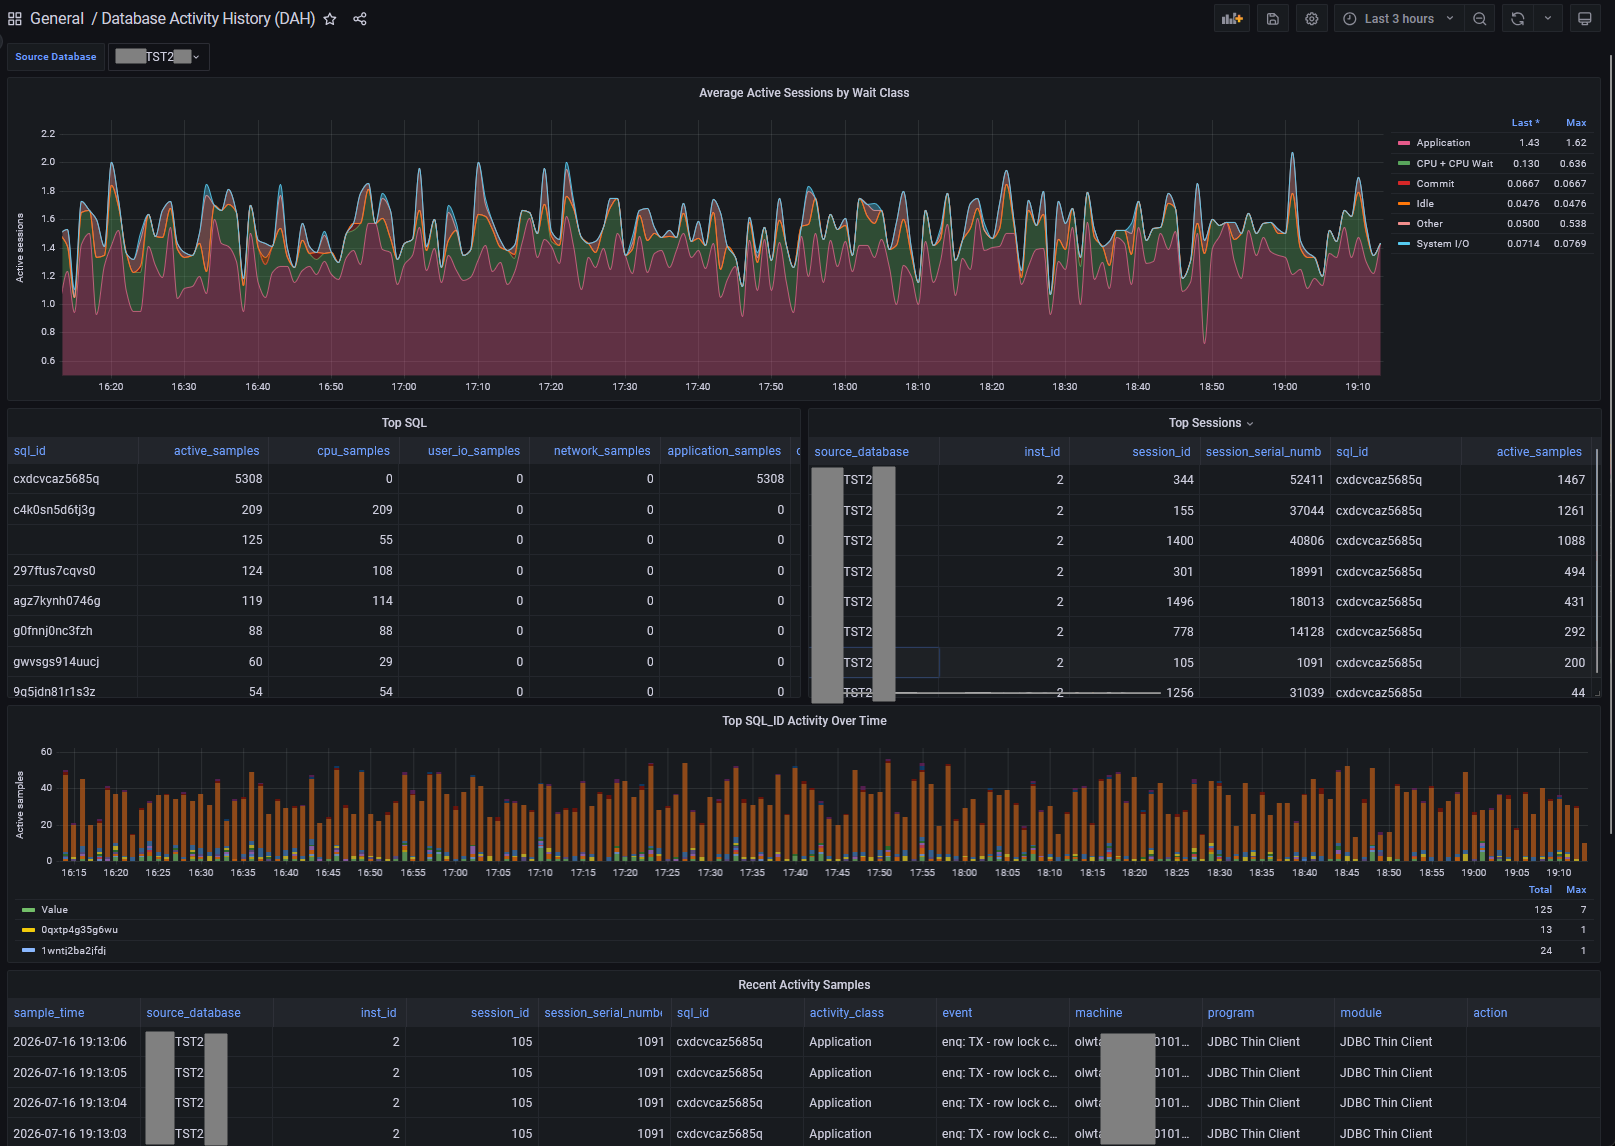
Database Activity History dashboard with anonymized sample data. Select the image to open it at full resolution.
The Activity Source variable keeps SESSION, ASH, and migrated LEGACY
rows separate. SESSION is the default collector. ASH appears only when the
scraper was explicitly configured to use Oracle ASH and the operator accepted
responsibility for verifying Diagnostics Pack licensing.
Oracle SQL Performance
File:
docker-compose/grafana/dashboards/oracle-sql-performance.json
Purpose:
- Top SQL by elapsed time delta.
- Top SQL by CPU time delta.
- Top SQL by User I/O wait delta.
- SQL efficiency outliers.
- Short SQL text previews in ranking tables.
Primary tables:
oracle_sql_samples
oracle_sql_texts
oracle_sql_plans
This dashboard is the category overview. Select a SQL_ID in any ranking table
to open the same database, SQL ID, and time range in the Top Consumers
dashboard. Ranking tables intentionally show only a short SQL preview.
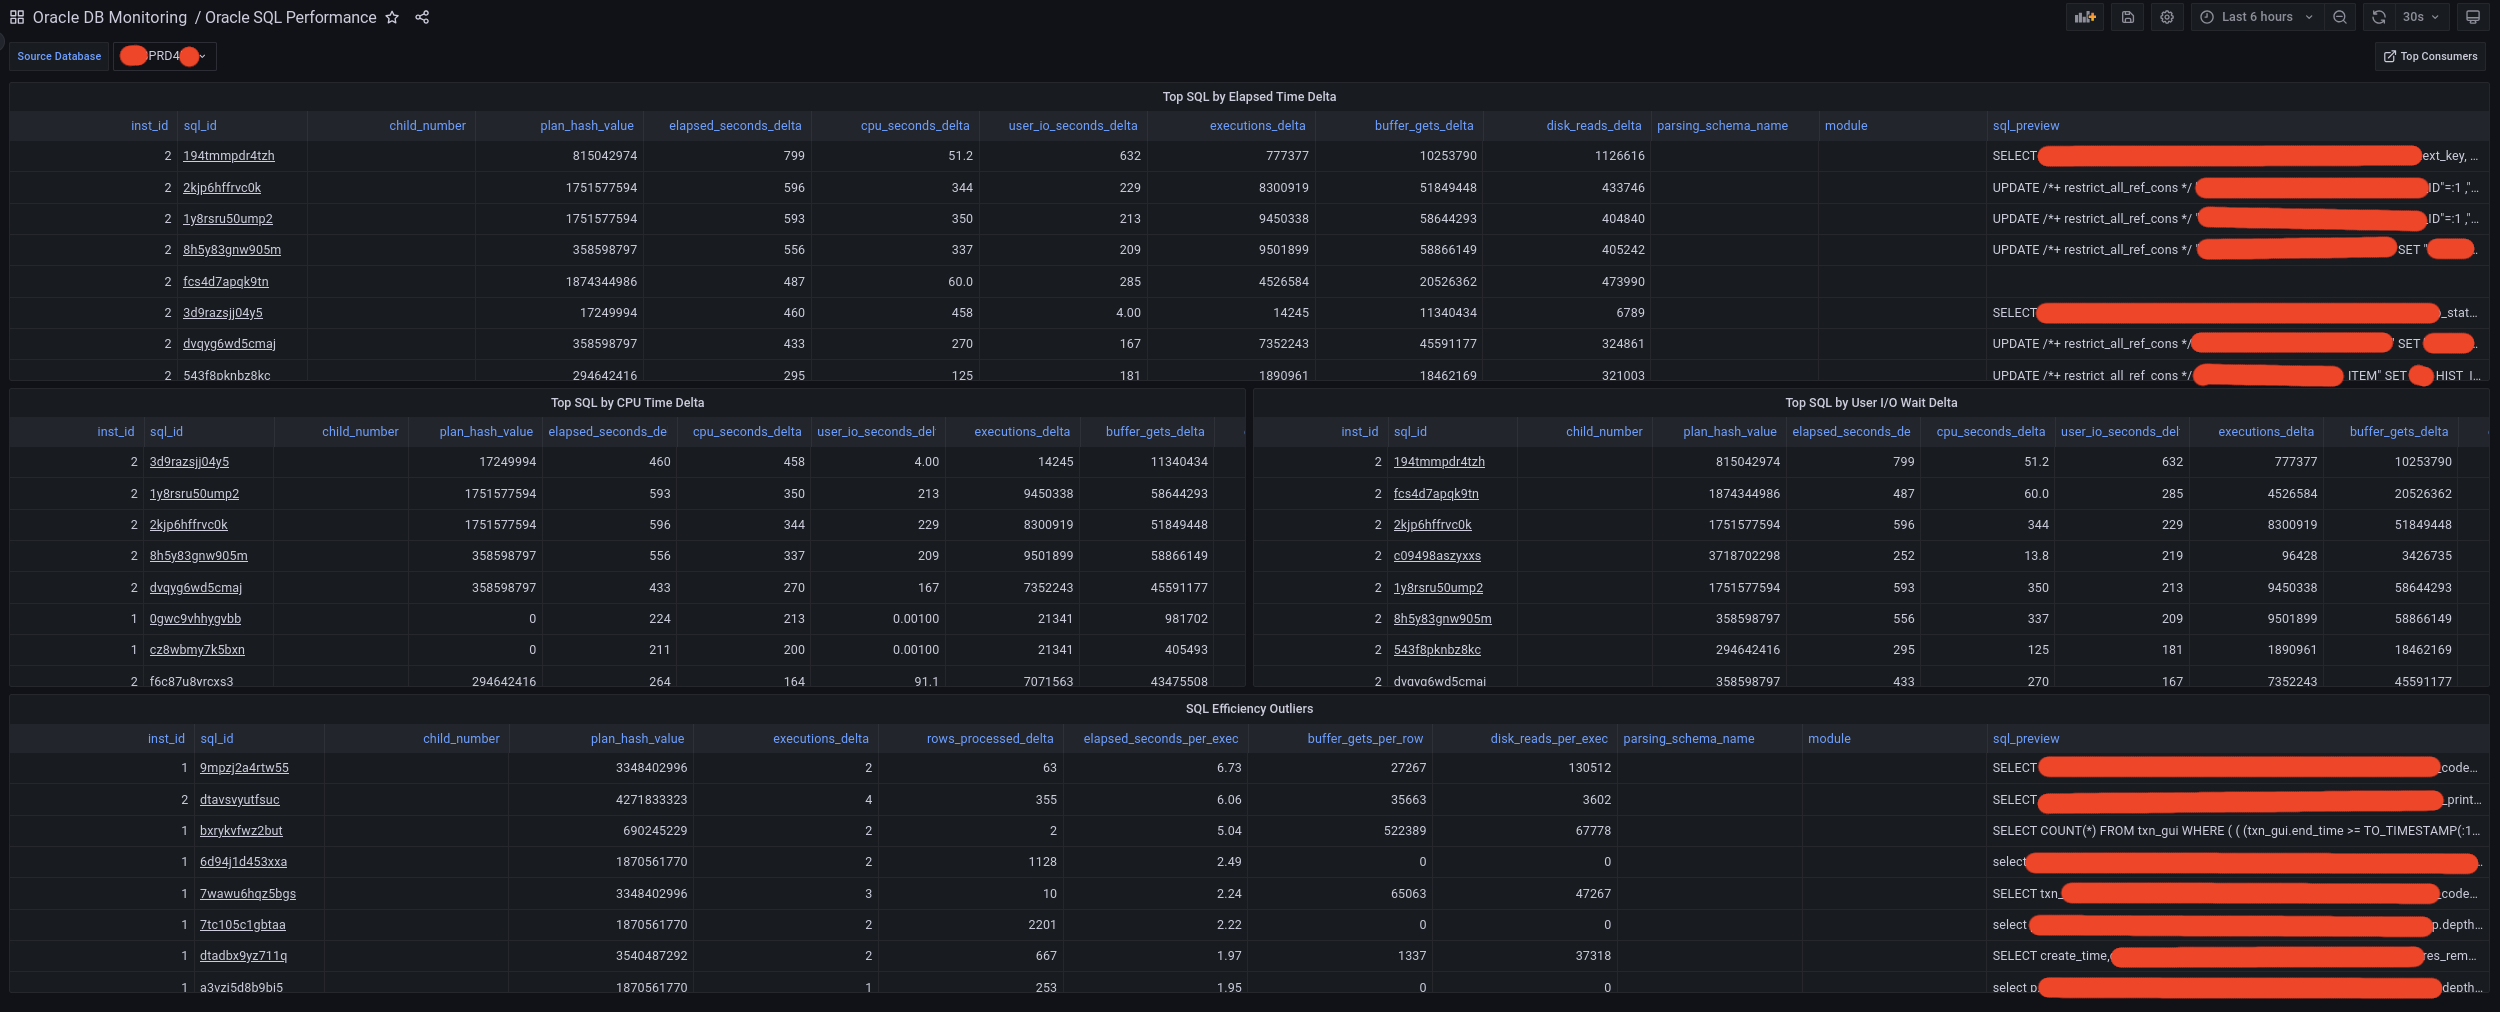
Oracle SQL Performance dashboard with anonymized sample data. Select the image to open it at full resolution.
Oracle SQL Top Consumers
File:
docker-compose/grafana/dashboards/oracle-sql-top-consumers.json
Purpose:
- Top 20 SQL consumers by elapsed-time delta for the selected time range.
- One-minute average database-time contribution for elapsed, CPU, User I/O, application, concurrency, and cluster time.
- One-minute average execution, row-processing, and parse-call rates.
- One-minute average buffer-get, disk-read, and direct-write rates.
- Category ranks and the dominant measured pressure for every top consumer.
- Available plan hashes and cached execution-plan operations.
- Complete
SQL_FULLTEXTfor the selectedSQL_ID.
The top table is the entry point for statement-level troubleshooting. Select a
SQL_ID to populate the detailed graphs, full SQL text, and plans below it.
Select PLAN_HASH_VALUE when a statement has multiple collected plans. The
plan panel displays the cached GV$SQL_PLAN operation tree, objects, optimizer
estimates, partition bounds, and predicates; it does not contain runtime
ALLSTATS values.
Plan-operation colors identify access and join methods for visual scanning; they do not classify an operation as universally good or bad. Full application table scans and Cartesian joins are red, index access is green, hash joins are yellow, nested loops are blue, merge joins are orange, and sorts are purple. Oracle fixed-table scans are not treated as application-table full scans.
The review_signal column highlights an initial investigation point:
CARTESIAN: the operation or options containCARTESIAN.FULL SCAN: aTABLE ACCESSoperation has aFULLoption.TEMP: the optimizer estimates non-zero temporary space.HIGH ESTIMATE: estimated cardinality is at least 100,000 rows, estimated bytes are at least 100 MiB, or optimizer cost is at least 10,000.
These are heuristics. Object size, selectivity, actual row counts, and workload frequency still determine whether an operation is a performance problem.
The top table totals counter deltas over the selected dashboard range. Detail graphs first divide each delta by the actual interval between PostgreSQL samples, then average those rates into one-minute buckets. This avoids a misleading sawtooth when a cumulative Oracle counter changes less frequently than the scraper interval. A zero remains meaningful: no corresponding work completed during that observation interval.
SQL text and plan details are collected on the bounded performance.sqlPlans
schedule. A top consumer can therefore appear before its detail is collected,
or after its Oracle cursor has aged out. The dashboard reports that state as
Not collected or aged out instead of hiding the SQL statistics.
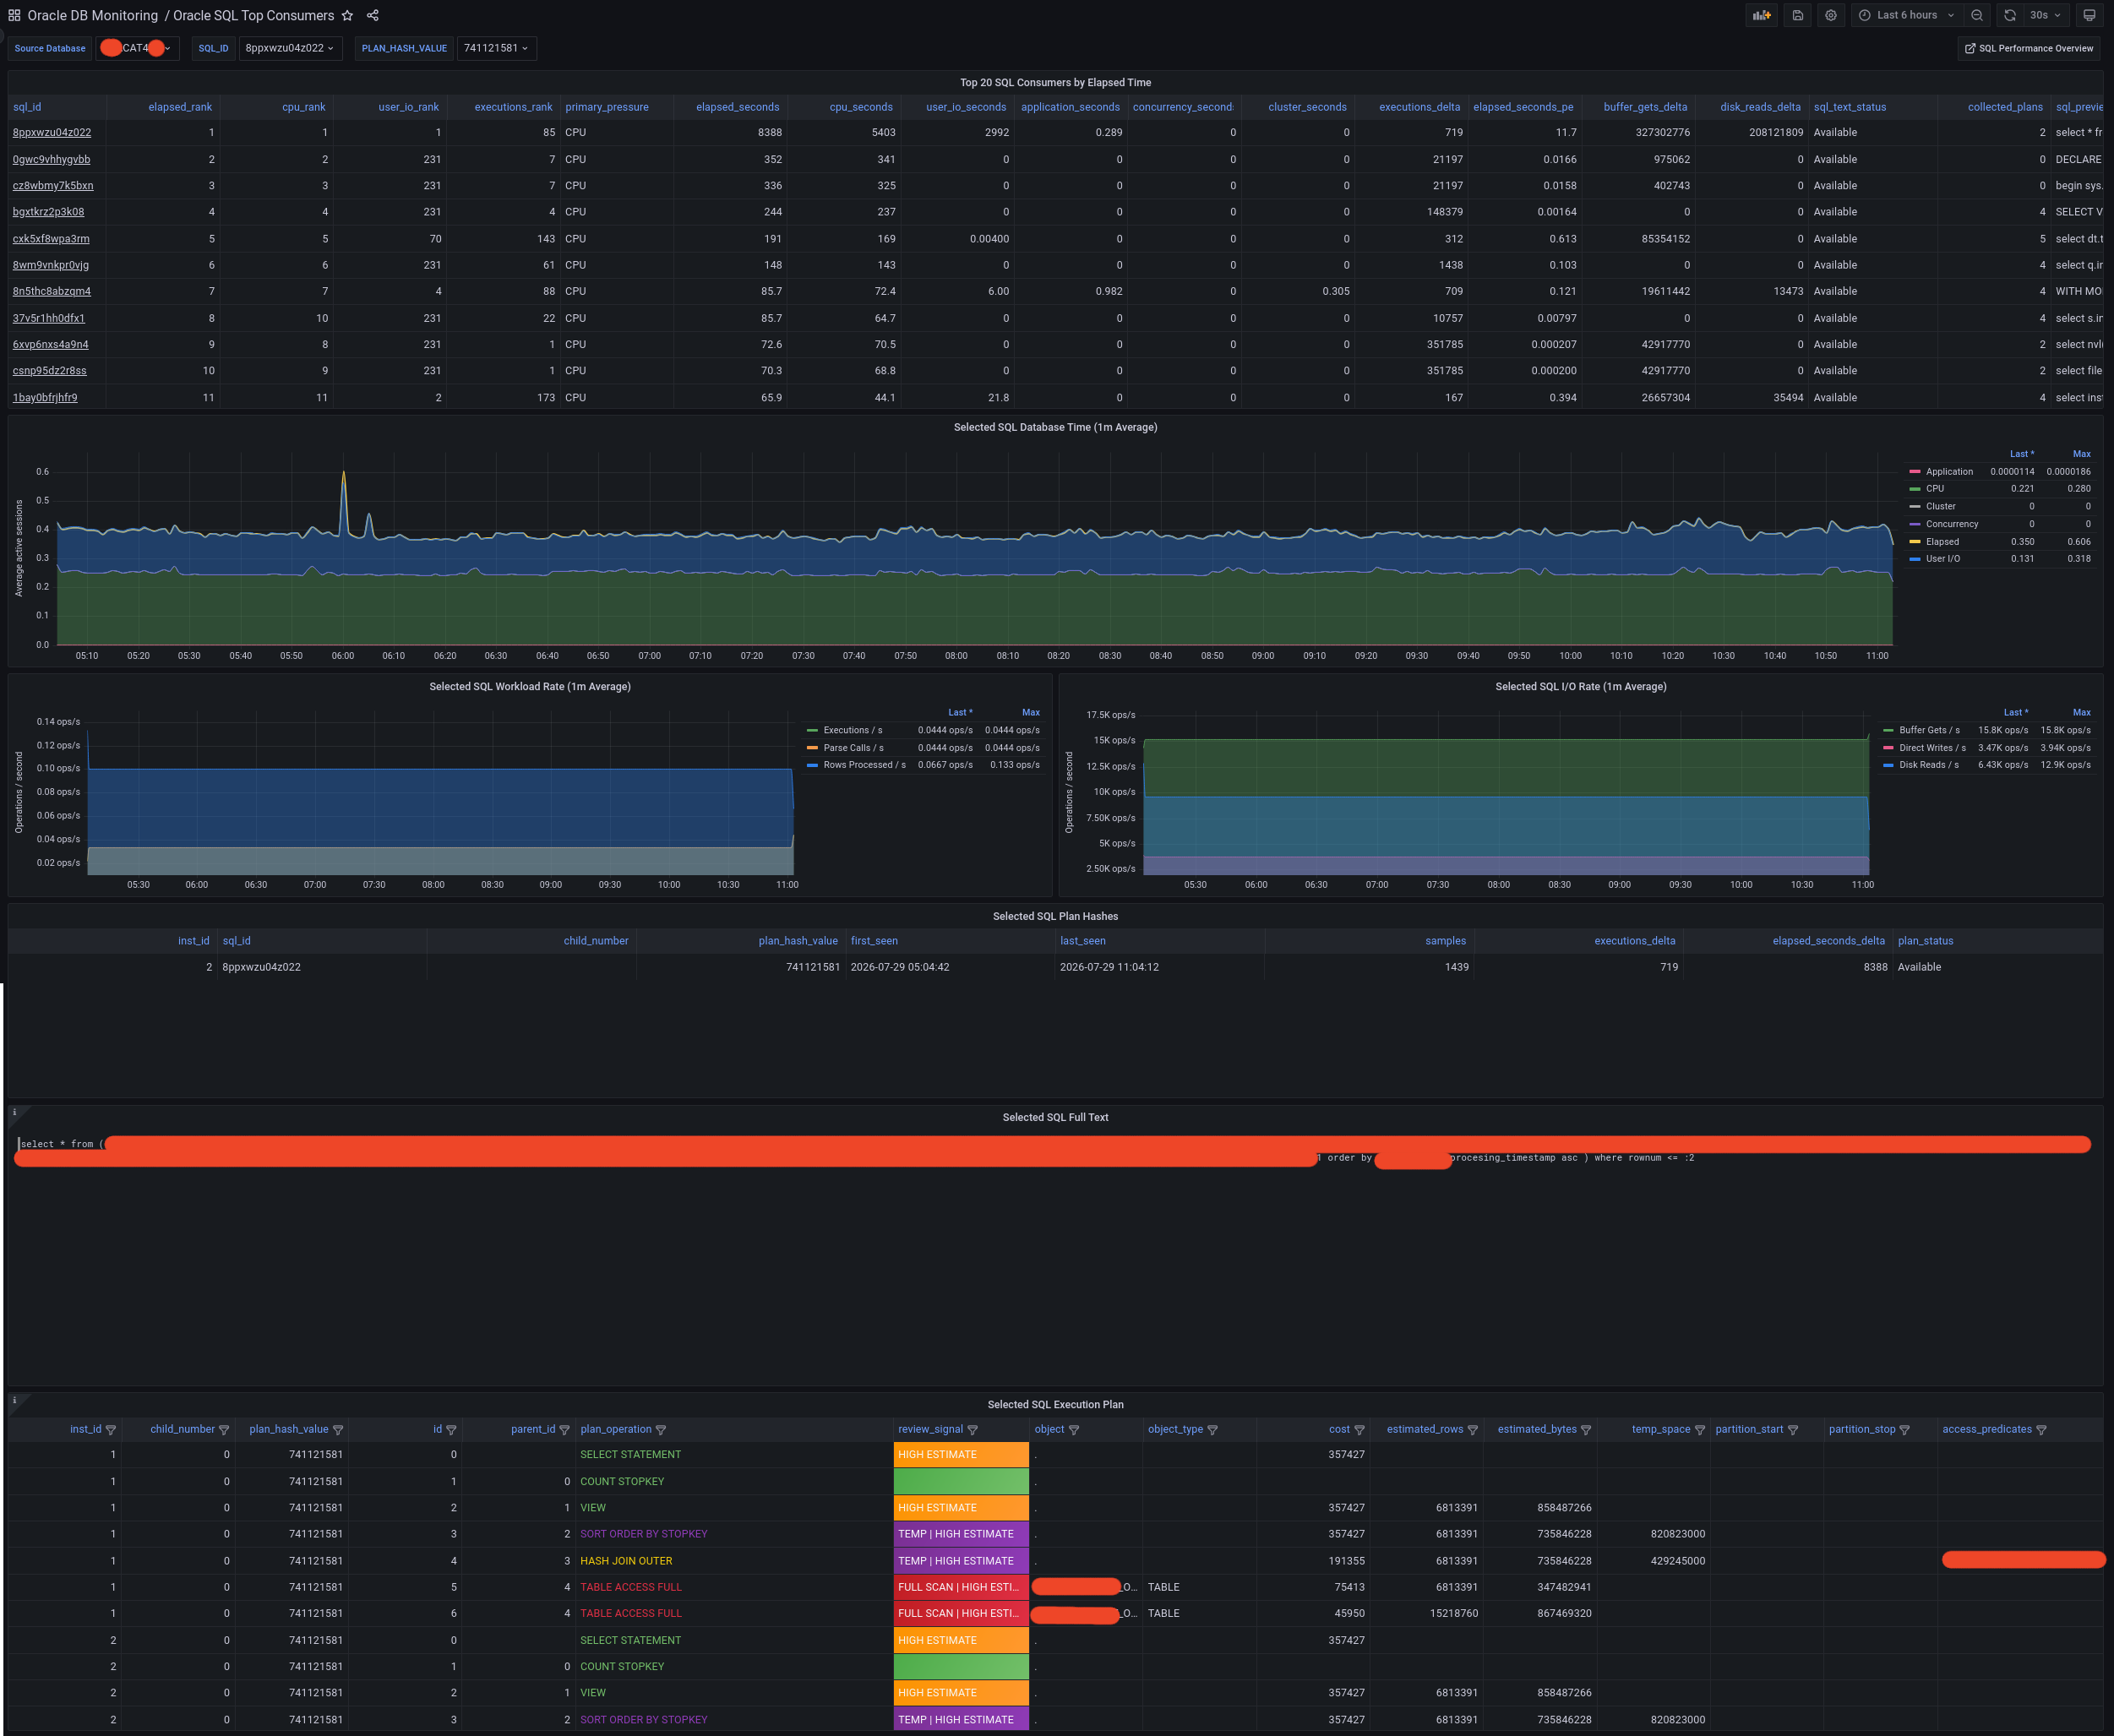
Oracle SQL Top Consumers dashboard with anonymized sample data. Select the image to open it at full resolution.
Current Sessions and Blocking
File:
docker-compose/grafana/dashboards/oracle-sessions-and-blocking.json
Purpose:
- Current active SQL sessions.
- Current waiters by event.
- Long-running active sessions.
- Blocking sessions.
- Session inventory by user, module, and program.
Primary tables:
oracle_session_samples
oracle_blocking_session_samples
This dashboard is the current-state triage view. Historical active-session graphs live in the DAH dashboard instead.
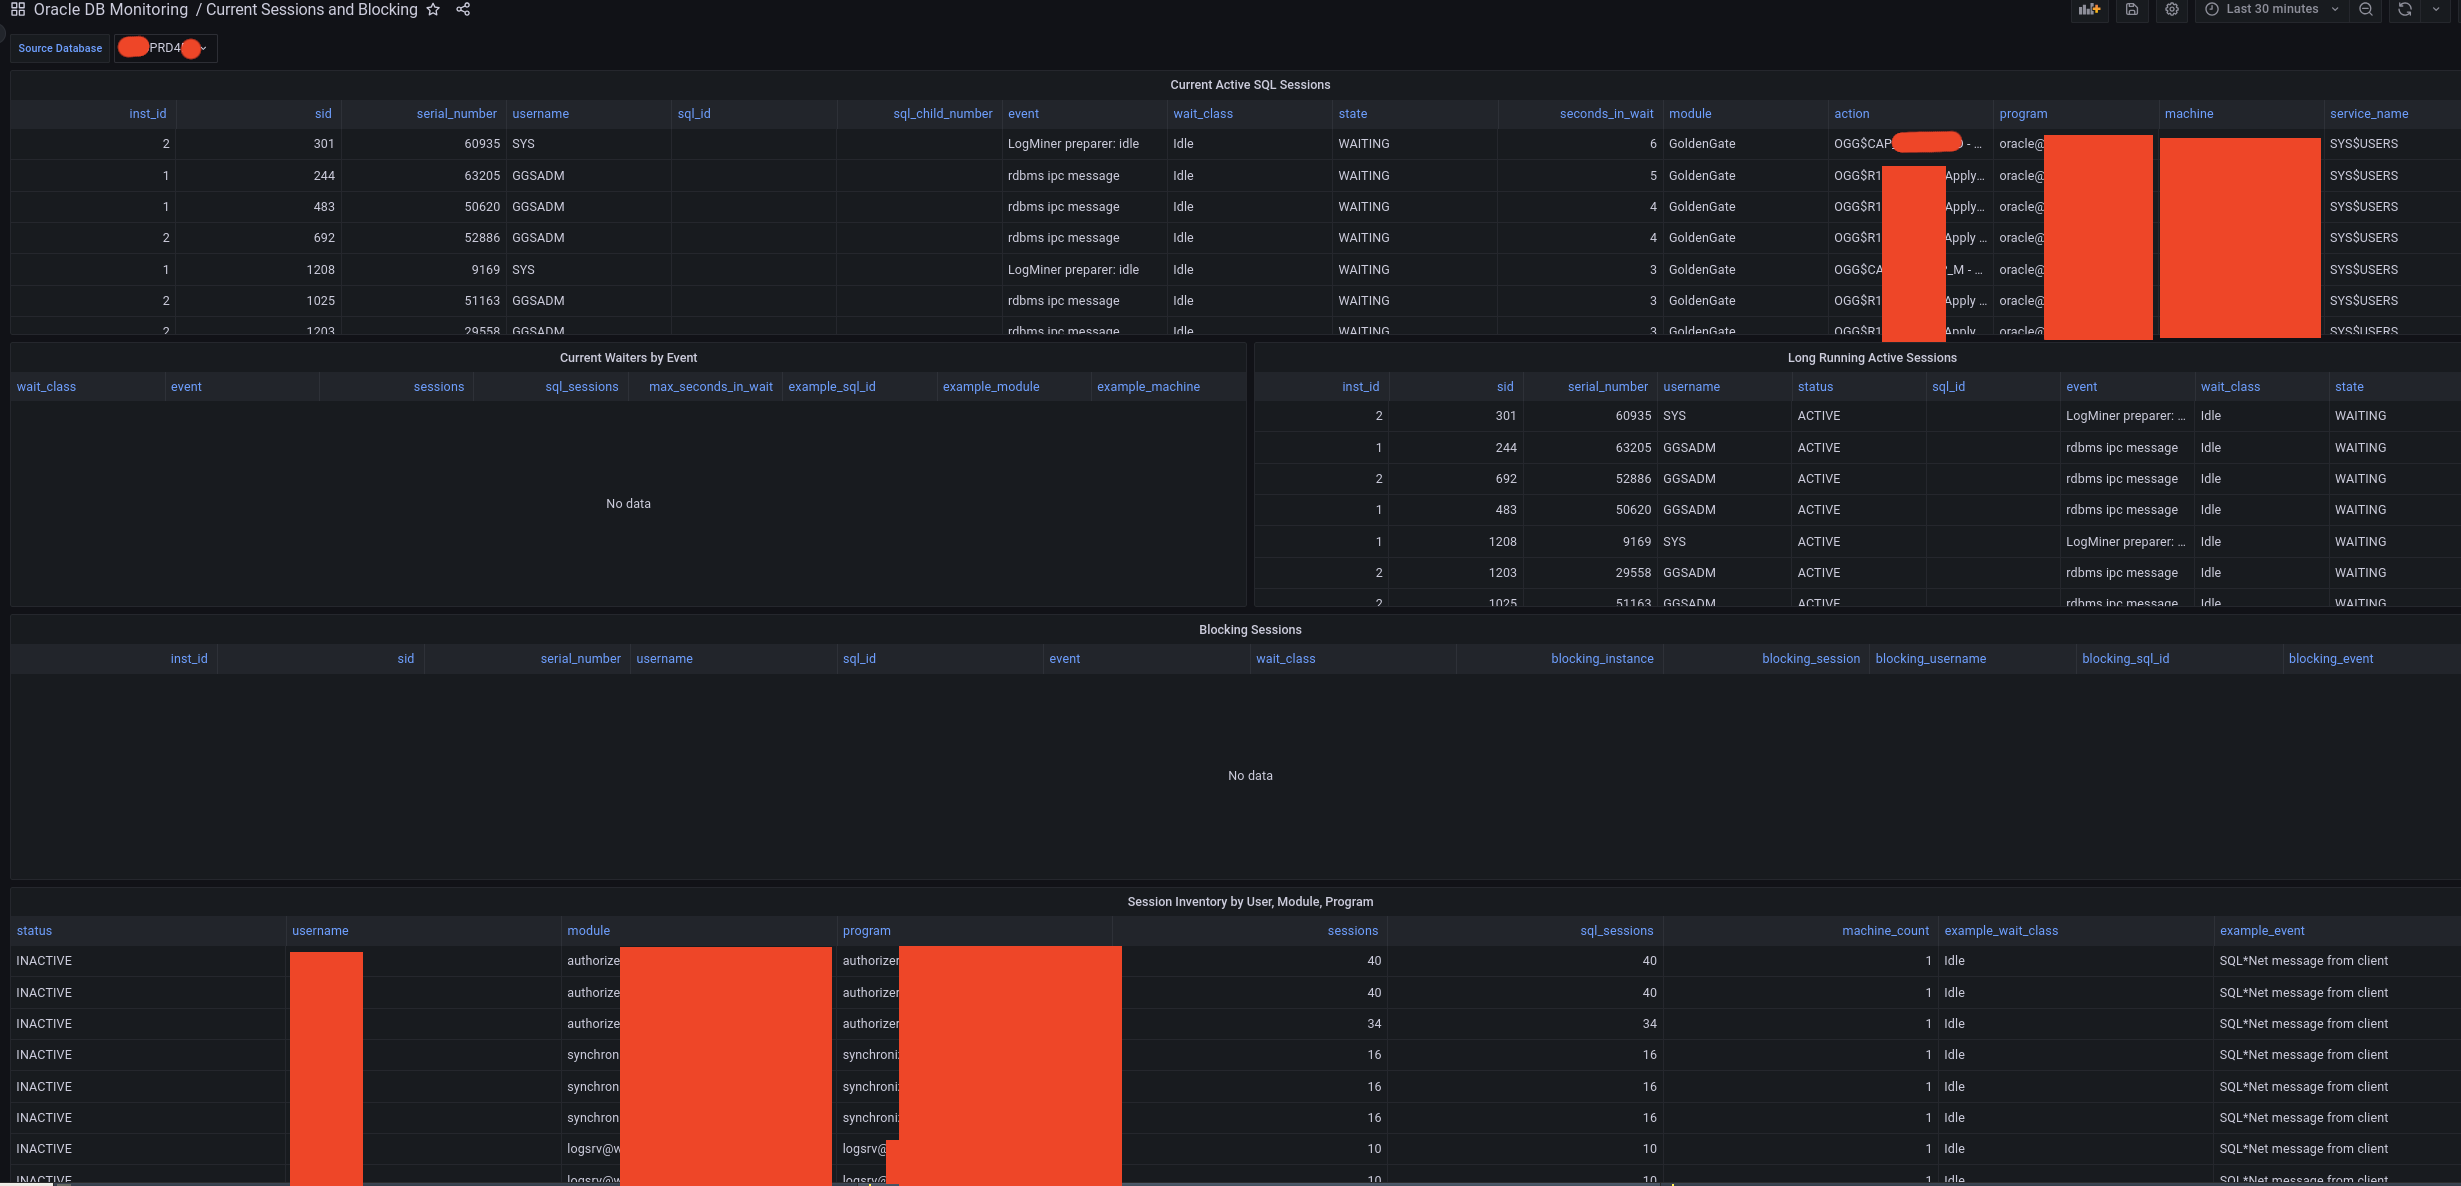
Current Sessions and Blocking dashboard with anonymized sample data. Select the image to open it at full resolution.
Importing Manually
If you are not using the Compose provisioning files:
- Create a Grafana PostgreSQL datasource.
- Set its UID to
PostgreSQL, or edit the dashboard JSON files to match your datasource UID. - Import the JSON dashboards from
docker-compose/grafana/dashboards/.
Required Data
The dashboards assume the scraper is writing these tables:
oracle_database_activity_samplesoracle_sql_samplesoracle_sql_textsoracle_sql_plansoracle_session_samplesoracle_blocking_session_samplesoracle_database_status_samplesoracle_instance_samplesoracle_resource_limit_samplesoracle_tablespace_samplesoracle_asm_diskgroup_samplesoracle_system_counter_samplesoracle_wait_class_samplesoracle_scrape_status
If a dashboard is empty, verify:
metrics.scrapeIntervalis configured.- PostgreSQL
output.postgresql.urlis correct. - the Oracle monitoring user can query the relevant
GV$views. - Grafana time range includes recently collected rows.
Grafana Alerting
The Docker Compose stack also provisions PostgreSQL-backed starter alert rules for collection freshness, Oracle connectivity, tablespaces, resource limits, and ASM. See Grafana Alerting for rule deployment, contact points, and the required independent monitoring of the scraper, PostgreSQL, and Grafana themselves.